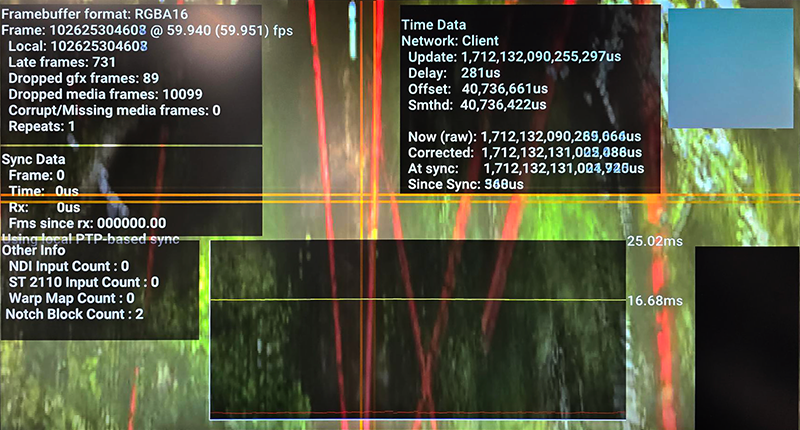
Statistics and timing information can be superimposed on screen per viewport by switching Display Actor Rendering Stats to On in Configuration > Settings > Preferences.

When displayed on screen, moving crosshairs will reveal timing differences between display devices. Top right, a square alternates red and cyan so should appear steady grey. The black square bottom right flashes white every 10 frames: all displays should be in sync.
The central graph shows a yellow line for frame time, and the red below are each frame’s render time up from 0 at the bottom axis to the yellow line being 1 frame.
Statistics can give an idea of how frames are being handled per server.
Framebuffer format
As Settings > Preferences
Frame counter
A running count of frames played and the frame rate
Local
Frames counted on the local device
Late frames
Late frames tracks both dropped graphics and dropped media frames.
When an image has been requested to load from disk but the frame index was behind, the frame has been discarded and not requested to be uploaded to the GPU in the upload thread.
or:
When an image has been loaded from disk to RAM and uploaded to GPU memory, but was received by the render thread too late.
Dropped graphics frames
We didn't actually manage to render an image this frame (typically because the renderer is still busy rendering the last frame, and missed the deadline for presenting it).
When an image is loaded from disk to RAM and uploaded to GPU memory but was received by the render thread too late.
Dropped media frames
We didn't manage to load the image off disk into GPU memory in time for rendering.
A count of images that are missing when rendering occurs. In theory, every late frame results in a dropped media frame.
Repeats
The local frame count hasn't incremented since we last ran the renderer. Typically caused by bad SyncData being received from the server (eg: if the server is running in desktop mode, but isn't genlocked).
The remaining stats are primarily for sync and timing technical diagnosis.
Sync Data
Used to synchronize all client machines to the server, sync data is sent periodically to regulate the internal clocks of client servers. Frame and Time are both sent from the server and Rx represents when it was sent.
‘Frames since Rx’ is the only local client-based figure. It is the number of frames since the last time a sync pulse was received.
The last line of sync data indicates the mode of sync timing, for example, PTP, employed by the whole Compere/Actor system. Timing mode is set in the preferences. Another option for sync is using the GPU clock.
Time Data
Used to make ensure all clocks are in sync. Similar to sync, it is sent from the server, but is restricted to time-only data.
‘Update’ is the last update time of the sync data.
‘Offset’ is last calculated clock offset between the server time and this clients time. e.g. server might be at 1000 client at 998. so offset this time is 2. but the calculation prior could be 3.
‘Smthd’ is the clock offset smoothed so that it doesn’t jump around based on newly calculated offsets, for example after a spike in time difference.
‘Now (raw)’ is the raw local time of the device.
‘Corrected’ is the raw time + the calculated smoothed offset. So the time synchronized to the server.
‘At sync’ is the time the sync was received and ‘Since sync’ is the time since then.