The playback window launches with DeltaServer. It can be toggled full-screen with the DeltaServer menu option: Display, or just by keying F. This window is not sized to the canvas.
Timecode / Movie Timecode Display
Drag either or both Timecode resources from the Resource (Text) pool onto the timeline, and enable or disable as required. The text size, colour, opacity and position are set in the resource properties (double-click, or right click the text resource on the timeline for the Resource Editor).
Information and Performance Display
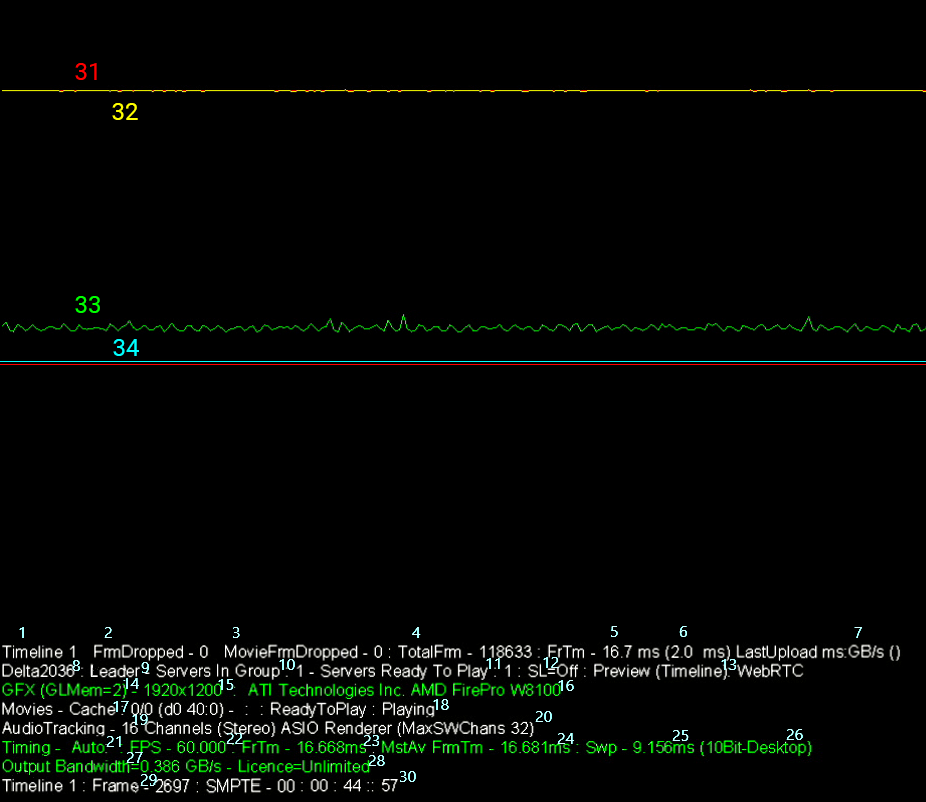
Information can be overlaid on the show, as seen here (the same is available to be viewed in Web Preview). Top left: timeline information, bottom left: playback settings, bottom right: audio VU meter bars, and in the centre: the playback performance graph (with legend, top right).

If enabled in Preferences > User Stats, the features available can be switched on and off with quick keys:
G : view the graph
I : view the timeline information (shown top, above)
A : view the audio VU meter
S : view the playback stats (shown as the lower block, above)
The following view adjustments are persistent whilst DeltaServer is running, and have been used in the illustration above:
Shift+arrows : Position the playback statistics on screen
Ctrl+arrows : Size the width and height of the playback statistics block (and type size)
Ctrl+Shift+arrows : Position the graph block
Ctrl+Shift+Q/W : Make graph block narrower/wider
Ctrl+Shift+Y/H : Make graph block taller/shorter
Interpreting the information
1.Timeline 1 – Indicates the Timeline selected in DeltaGUI.
2.FrmDropped – Indicates the number of dropped graphics frames since last reset. Dropped frames can be caused by many things, including open VNC windows, non-fullscreen playback, additional applications running, timing issues, or graphics overloading.
3.MovieFrmDropped – Indicates the number of dropped Movie frames since last reset. Movie frames drop when the disk bandwidth cannot keep up with the read request bandwidth in playback. This may happen with too many movies on the timeline, too large of files for a specified system, or indicate drive failures.
4.TotalFrm – Indicates the number of frames (always increasing) since the show load.
5.FrTm – Indicates the nominal time in ms per frame.
6.FrTm() – Indicates the time in ms that the current frame goes through render loop.
(A developer debug tool only.)
7.LastUpload ms:GB/s () – Indicates the upload time of the last asset.
(A developer debug tool only.)
8.Delta2036 – Delta Sever / PC Name.
9.Leader – Indicates if this server is a Leader or Follower.
10.Servers in Group – Indicates the number of Delta Media servers in a given server group.
11.Servers Ready to Play – Indicates the number of Delta Media servers in this server’s group that are cued.
12.SL=off – Indicates whether Seamless Loop is enabled or disabled.
13.Preview (Timeline): WebRTC – Indicates that Preview is enabled with the device name: WebRTC.
14.GFX (GLMem=2) – Indicates the registry setting: MoviesUseLocalGLMem = 2.
15.1920 × 1200 – Indicates the graphics resolution of the desktop (when in desktop playback mode).
16.ATI Technologies Inc: AMD FirePro W8100 – Identifies the GPU in use by the Delta Media server.
[SDI systems insert a line containing SDI performance indicators, status of Direct DMA (direct memory access), and SDI frame format.]
17.Movies – Cache 0/0 (d0/40:0) – Indicates the number of movies and resolution of those movies for playback.
18.ReadyToPlay : Playing – Indicates Delta Media server’s play status.
19.AudioTracking – 16 Channels (Stereo) – Indicates the number of audio channels for which Delta is configured.
20.ASIO Renderer (MAXSWChans 32) – Indicates the maximum number of parallel Audio voices, set in the GUI preferences. The setting dictates the total number of audio tracks allowed to be loaded into RAM for playback. Exceeding the maximum parallel voices (for instance by having 4 qty 8-channel audio files and 2 single-channel audio files overlapping on the timeline) will result in not all audio channels being audible.
21.Timing – Auto – Indicates the timing mode as set in the DeltaGUI Preferences > Timing tab. Auto will choose the best timing method for smooth playback.
22.FPS – 60.000 – Indicates the framerate as set in the DeltaGUI Preferences > Timing tab.
23.FrTm – 16.668ms – 1000ms / FPS
24.MstAv FrmTm – 16.681ms – indicates the actual framerate (master average) at any given time. This value will fluctuate slightly on normal playback.
25.Swp – 9.156ms – Indicates the difference in frame time and upload time.
26.(10Bit-Desktop) – Indicates that the desktop settings, Delta registry settings, and cabling are all set for 10-bit mode. This message will not appear in 8-bit mode or if any of these values do not allow for 10-bit desktop mode to be active.
27.Output Bandwidth=0.386 GB/s – Indicates the bandwidth used under the current graphics setup. (Desktop resolution * framerate * RGB when in desktop mode).
28.Licence=Unlimited – Indicates the licenced bandwidth allotment for this Delta Media server. Exceeding this value will overlay a ‘Bandwidth Exceeded’ message on the output raster.
29.Timeline 1 : Frame – 2697 – Indicates the current frame number of the specified timeline.
30.SMPTE – 00 : 00 : 44 :: 57 – Indicates the SMPTE time of the specified timeline.
31.RED LINE – A reference line to the timing value specified in 5/23, over time.
32.YELLOW LINE – A reference line to the timing value specified in 24, over time.
33.GREEN LINE – A reference line to the timing value specified in 6, over time.
34.BLUE LINE – A reference line to the audio stray in ms, over time.
SDI systems insert a line containing timing data, status of Direct DMA (direct memory access), and format
What the Graph Lines Mean
|
The two red lines denote the limits of playback: the bottom red line is represents a zero baseline, and the top shows how many milliseconds it takes to draw a single frame. The top red line is not always clearly visible as should be under the yellow line. The line spacing at 30 FPS playback therefore represents 33.3 ms, whilst at 60 FPS playback it represents 16.7 ms and at 120 FPS playback, 8.3 ms. The yellow line shows the time taken for the graphics card to actually draw the frame: if this spikes, it means that the graphics card is reading the movie frames but is unable to write them in time and so the (video) frame is dropped. The green line refers to the performance/load of the whole server: the CPU, RAM and GPU. |
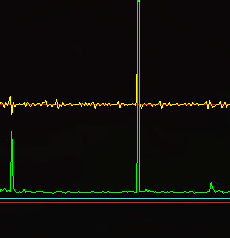
•When spiking between the red lines, it demonstrates an appropriate level of use that the server components can manage.
•If the green line spikes up above the top red line once, it means that the performance/load of the server was increased for a split second: this may cause a video frame drop due to the performance/load being too much for the graphics card to draw a frame in time.
•If it is constantly spiking up above the top red/yellow lines then your server is not coping with the demand on it, so you may need to reconsider its load.
•If the green line drops or spikes down this may be because the performance/load of the server is decreased and movie frame(s) cannot be read. This shows as a movie frame drop, as the frame cannot be rendered/drawn.
The blue line monitors the audio and is only in view if you have audio devices attached and audio resources on the timeline.
See also:
Page edited [d/m/y]: 14/01/2022