The playback window launches with DeltaServer. It can be toggled full-screen with the DeltaServer menu option: Display, or just by keying F. This window is not sized to the canvas.
Timecode / Movie Timecode Display
Drag either or both Timecode resources from the Resource (Text) pool onto the timeline, and enable or disable as required. The text size, colour, opacity and position are set in the resource properties (double-click, or right click the text resource on the timeline for the Resource Editor).
Information and Performance Display
Information can be overlaid on the show, as seen here (the same is available to be viewed in Web Preview). Top left: timeline information, bottom left: playback settings, bottom right: audio VU meter bars, and in the centre: the playback performance graph (with legend, top right).

If enabled in Preferences > User Stats, the features available can be switched on and off with quick keys:
G : view the graph
I : view the timeline information (shown top, above)
A : view the audio VU meter
S : view the playback stats (shown as the lower block, above)
The following view adjustments are persistent whilst DeltaServer is running, and have been used in the illustration above:
Shift+arrows : Position the playback statistics on screen
Ctrl+arrows : Size the width and height of the playback statistics block (and type size)
Ctrl+Shift+arrows : Position the graph block
Ctrl+Shift+Q/W : Make graph block narrower/wider
Ctrl+Shift+Y/H : Make graph block taller/shorter
What the Graph Lines Mean
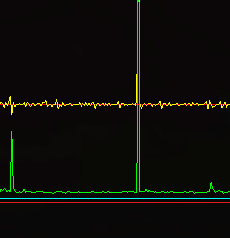
The yellow line shows the time taken for the graphics card to actually draw the frame: if this spikes, it means that the graphics card is reading the movie frames but is unable to write them in time and so the (video) frame is dropped.
The green line refers to the performance/load of the whole server: the CPU, RAM and GPU.
•When spiking between the red lines, it demonstrates an appropriate level of use that the server components can manage.
•If the green line spikes up above the top red line once, it means that the performance/load of the server was increased for a split second: this may cause a video frame drop due to the performance/load being too much for the graphics card to draw a frame in time.
•If it is constantly spiking up above the top red/yellow lines then your server is not coping with the demand on it, so you may need to reconsider its load.
•If the green line drops or spikes down this may be because the performance/load of the server is decreased and movie frame(s) cannot be read. This shows as a movie frame drop, as the frame cannot be rendered/drawn.
A blue line monitors the audio and is only in view if you have audio devices attached and audio resources on the timeline.
➢See also Viewing and Previewing Shows